When a chart is copied and pasted, Excel does not adjust the references to the source cells. For example, if a chart from Sheet1 that shows data from Sheet1 is copied to Sheet2, it will continue to show the data from Sheet1. The Point Chart function allows you to change the worksheet that a chart is referencing.
You can choose whether you want to adjust the selected chart’s references, or the references of all charts in your worksheet. The current worksheet is automatically selected, making it very easy to adjust the references of a pasted chart to the chart’s new sheet.
Adjust error bars afterwards: If your chart contains error bars, you may wish to adjust their cell references, too. When this option is checked, the Interactive Custom Error Bars function will be executed automatically.
How Excel stores cell references to charts
When you click on a data series in your chart (e.g., click on a bar or a line), the formula field at the top of the screen shows the chart’s “Series Formula”:
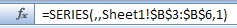
As you can see, Excel stores the worksheet name (“Sheet1”) along with the cell reference (”$B$3:$B$6”). This worksheet name is not automatically adjusted when a chart is copied and pasted to another sheet. The Point Chart function of the XL Toolbox goes through every series in the chart(s) and adjusts the worksheet name for the Name, X, and Y properties of the chart series.
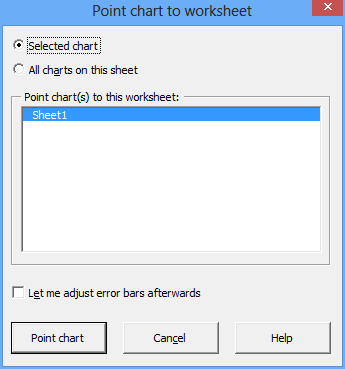
Point chart