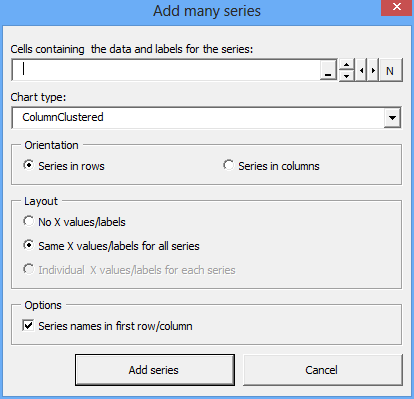
The “Select data” (Excel 2007-2013) or “Data source” (Excel 2000-2003) commands can be used to add new data series to a chart, but in some situations, they are not flexible enough. The XL Toolbox offers an alternative and more powerful way to add many chart series add once to a chart.
Usage is straight-forward and self-explanatory. Indicate the cell range that contains the data you want to add to the chart. Select the type of chart from the drop-down box (the current chart’s chart type is preselected by the Toolbox). Indicate if your data series are in rows or in columns, and if there are names for the series in the first cells.
For XY scatter plots, you can have individual X and Y values for each series.
Add many data series at once.
Add many data series at once.