The Multi Histogram function summarizes your data by counting the data points in distinct value ranges (“bins”). You can then use this summary to plot a histogram chart.
The Multi Histogram of Daniel’s XL Toolbox has several advantages: It can automatically suggest bin limits and bin sizes; it can calculate percentages and cumulative percentages; it can combine several columns into one data set; and if you are using Excel® 2007, it can output dynamic formulas instead of static counts (this requires the =COUNTIFS() function which was introduced in Excel® 2007 only.)
Citation
The multi-histogram feature has been cited in this publication:
Drake, A. (2015) Mapping of Massive Ground Ice Using Ground Penetrating Radar Data in Taylor Valley, McMurdo Dry Valleys of Antarctica. University of Uppsala, Sweden. ISSN 1650-6553 Nr. 330
Using the Multi Histogram function
Input/output ranges
Place the data that you want to analyze in columns and invoke the Multi Histogram function. Select the cells containing the data as “input range”, and select cells as an output range. The output range will be automatically adjusted to hold all the generated output; thus you can select a single cell as output range.
Parameters
- Combine columns: The Multi Histo lets you combine several columns as one data set; for example, if you have measured cell sizes with a microscope, you may want to analyze several fields of view for each sample. If you have the same number of fields of view per sample, you can place all of the data into individual columns and tell the Multi Histogram function to combine columns.
- Minimum and maximum bin limits; bin size: These values are self-explanatory.
- Auto: When you click the Auto button, bin limits and bin size are automatically calculated from your data. The minimum and maximum limits correspond to the maximum and minimum values in your data. The bin size is calculated according to Scott, Biometrika 1979;66:605:
BinSize := 3.5 * StDev / Count1/3
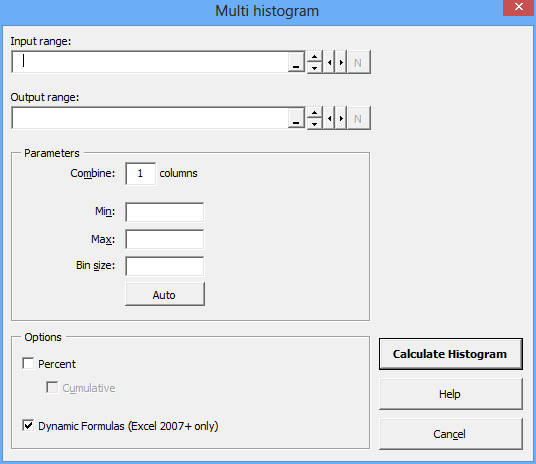
Multi-histogram form
Options
- Percent: Click to obtain percentages instead of absolute counts.
- Cumulative: When calculating cumulative percentages, every bin contains the sum of all previous bins. The sums will be monotonously ascending, and the last bin will be 100% (see picture).
- Generate formulas: Click to generate dynamic formulas instead of static data. This is useful if you want to be able to verify linked cells, or to easily change bins by editing the bin labels. This option is only available in Excel® 2007, which knows the =COUNTIFS() formula that is required to compute the histogram data.
![]()