Correlation tests if there is a relationship between two variables that do not logically depend on one another.
For example, you could count the number of cars in the street and the number of pedestrians on the sidewalk and see if they are correlated. Both numbers (variables) do not logically depend on one another.
However, if you were to experimentally vary the width of the sidewalk and then count the number of pedestrians, one might assume a logical dependency. It is possible that varying the size of the sidewalk has an effect on the number of pedestrians, but it would not make sense to assume that the converse might be true as well: Varying the number of pedestrians certainly won’t affect the size of the sidewalk. Whenever you have an independent and a dependent variable, you need to perform a linear regression rather than a correlation analysis.
Usage
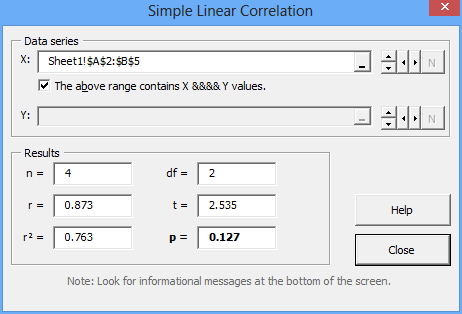
Using the Correlation feature of the XL Toolbox is very straight-forward. You can either select the X and Y data ranges in the Correlation dialog (see screenshot), or you can first select an XY scatter plot and then click on Correlation.
If the Correlation analysis cannot be performed, for example if the X and Y ranges are not the same size, you can see an informational message in the Excel status bar at the bottom of the screen.