Export Excel charts to SVG files
To add the ability to export Excel charts to scalable vector graphic (SVG) files is a high priority in Toolbox development. However, even though I have started to write some code, it will take a very long time before it is usable due to time constraints at my end.
It turns out that it is not that difficult at all to generate SVG files from Excel graphs, but it involves a few intermediate steps and is not as comfortable to use as a fully automated process.
Requirements
In order to export Excel graphs to SVG, you need:
- A fairly new version of Excel (2007 or later)
- Inkscape
Step 1: Produce a PDF file from your charts
First of all, you need a PDF file of your charts. This is easy if you have
Excel 2007 or later: Simply use the Save as command and choose PDF as
the file type. If you want to have one chart per page, you can either
place the chart as a separate sheet (find the command in the chart’s
right-click menu), or you can copy-paste the chart into a PowerPoint®
presentation.
If a chart is selected, Excel will produce a PDF with only this chart on the page. The chart will be rather large. If you have nothing (or rather, just a single cell on the spreadsheet) selected, Excel will produce a PDF of the entire spreadsheet, and the size of the chart will be preserved.
Step 2: Import the PDF file into Inkscape
Start Inkscape, and open your newly generated PDF file in it. You will need to indicate the number of the page that you want to import; Inkscape can only handle one page at a time. This makes the entire process rather cumbersome if you have lots of images, but it’s better than nothing until the XL Toolbox’ SVG export feature is ready.
The following is a screenshot of the Inkscape import settings (version 0.48.4):
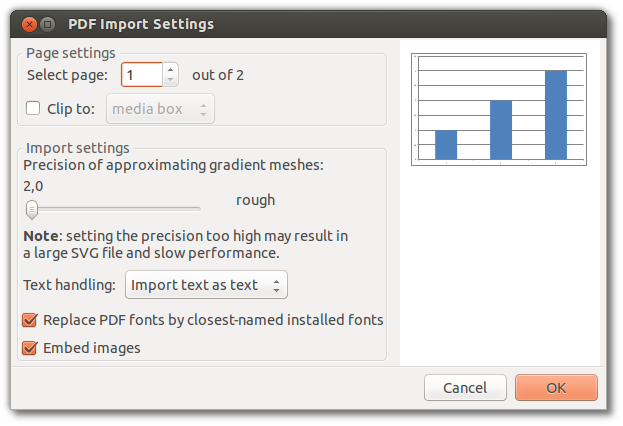
Important note regarding fonts
Unlike PDF files that carry everything in them that is needed to display the file contents, SVG files do not contain the actual fonts, just font names. Therefore, if you view an SVG file that contains text on a computer that does not have the particular font installed, the closest matching font will automatically be determined. The resulting image may look different from what you may have expected.
A work-round for this technical limitation of SVG files is to change all text to paths. However, currently the Inkscape PDF import facility does not offer to convert text to paths. Therefore, it says “Import text as text” in the PDF Import Settings displayed above.
There is one drawback to converting text to paths: You can no longer edit the texts by typing on the keyboard. Instead, you would have to directly manipulate the glyphs – definitely not feasible for editing text!
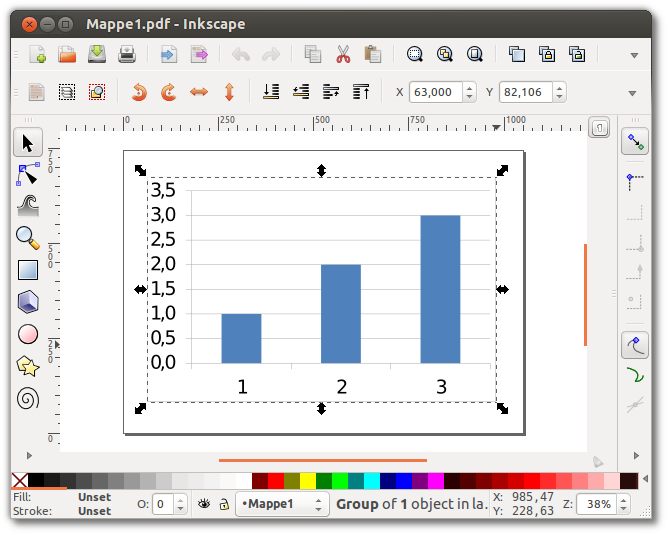
Step 3: Polish the imported graphic
Excel charts contain a lot of invisible graphical “garbage”. In the example screenshot below, a white rectangle has been selected. This is the ‘chart area’, not to be confused with the ‘plot area’ which is the area that is surrounded by the axes. In most cases, both the chart and the plot areas will be white or transparent, and should be discarded.
If you don’t get rid of the (white or transparent) chart and plot areas, you may get unexpected results when you import the SVG file into other programs such as OpenOffice/LibreOffice, who draw thick black borders around the chart and/or plot areas.
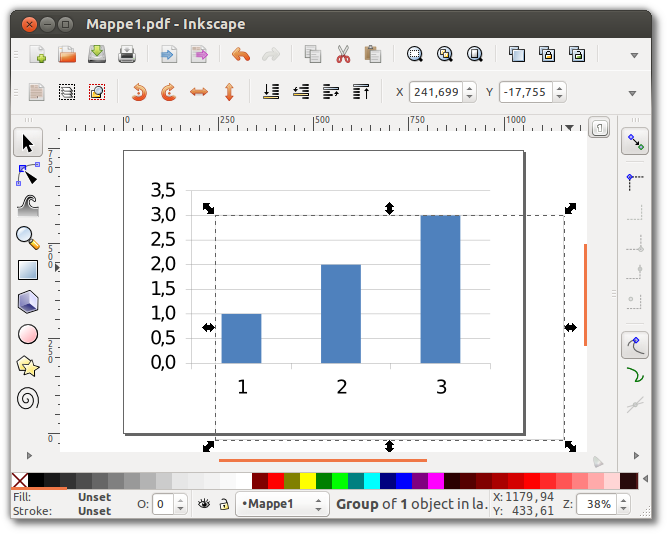
The following screenshot demonstrates that the chart area, once selected, can be moved out of the way without changing the chart’s appearance. It is save to delete it.
Step 4: Export to SVG
The final step is very simple: Just save the Inkscape drawing as an SVG file.
If you feel adventurous, you can open the resulting SVG file in a text editor, and replace all occurrences of a font name with some generic font name that you expect to be present on all computers that will be used to view this file, e.g. ‘Arial’. Or even better, you may want to take care that the Excel charts use only common fonts in the first place.
Step 5: Admire the result in your text processor of choice
The SVG file can now be imported into your text processor of choice. The screenshot below shows the Excel chart embedded in a LibreOffice Writer document on Ubuntu Linux.
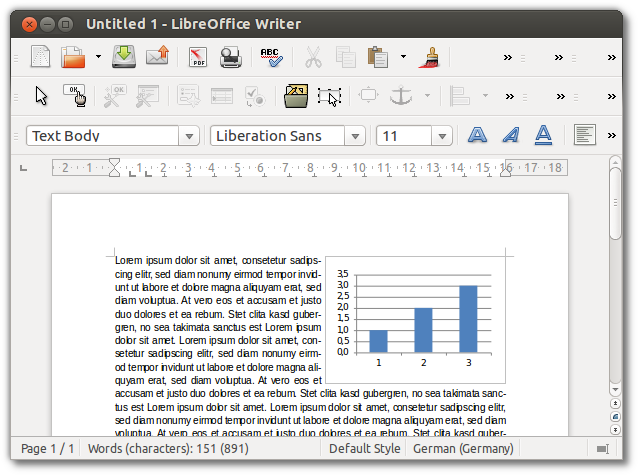
The graphic file will scale very well, and the resulting file size is much smaller than with ‘traditional’ bitmap files such as TIF or JPG.
Have fun!
Post date
Tue 25 Feb 2014Tags
Share
Recent posts
Exit ThinkPad T430s, enter ThinkPad T480s
Linux and VirtualBox on a T480s with high-resolution display
What I like and dislike about Ubuntu 18.04